


In the aftermath of Hurricane Helene, one of the most critical tasks for first responders was determining which buildings needed immediate attention. With some homes and businesses being swept away completely by rivers that rose dozens of feet in a matter of hours, having property data available in a searchable format could significantly speed up identifying areas of concern. By using Lucenia as an efficient search platform, responders can cross-reference flood zone information with property data, helping to locate at-risk buildings more quickly. This streamlined access to information enables more efficient decision-making, saving precious time and potentially lives during disaster relief efforts.
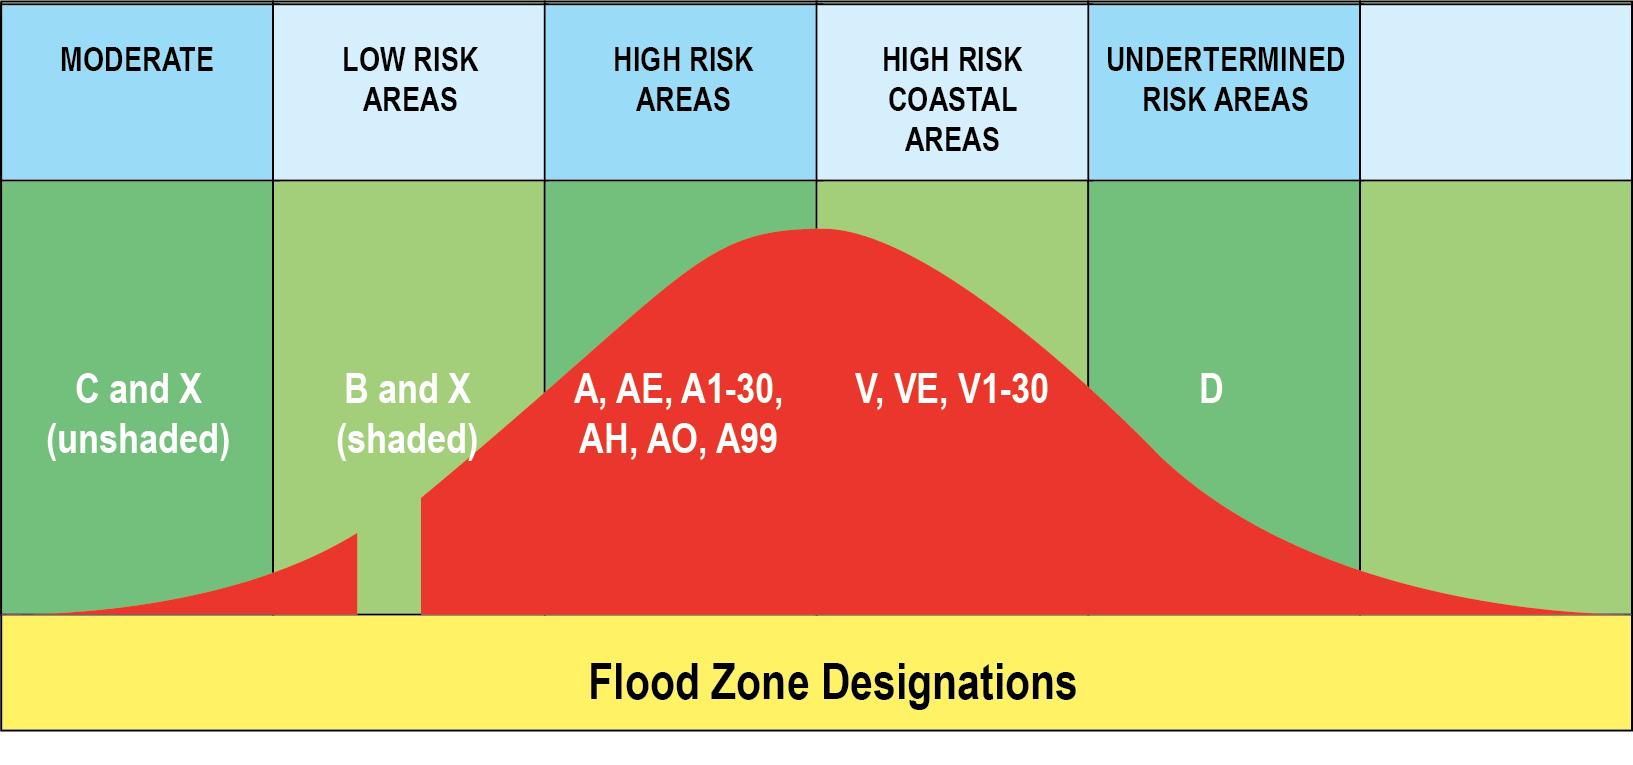
A key component in this process is the ability to quickly and easily ingest FEMA flood zone data into Lucenia and perform spatial analysis. FEMA's flood risk classification system designates properties based on the probability of flooding over a 100-year period. In "high-risk" zones, typically marked by the letter 'A', there are further subcategories indicating specific flood risks, such as the likelihood of experiencing less than one foot of water, one to three feet, and more. FEMA’s NRCC (National Response Coordination Center) uses spatial analytics dashboards to inform and manage disaster response in such situations. For example, when Hurricane Helene swept through western North Carolina, the French Broad River surged dramatically due to the intense rainfall in the Blue Ridge Mountains. By leveraging search capabilities like those provided by Lucenia, responders can analyze where floodwaters were likely to inundate the city of Asheville, located along the river's banks.
When Helene went through western North Carolina, the French Broad River handled the millions of gallons that fell in the Blue Ridge Mountains. Using Lucenia, we can sift through where water might have ended up in Asheville, on the banks of the river.
Using Python to analyze FEMA flood zone data
We’ll be creating two separate indices for the sample data. Index A will contain coordinates and FEMA flood zone classification data of flood zones around the Asheville, NC area. Index B will contain coordinates of all buildings inside a given bounding box, also around Asheville.
Prerequisites:
1. Make sure that Python is installed, then run the following command:
git clone git@github.com:lucenia/lucenia-tutorials && cd lucenia-tutorials/3_python_client && source .env
2. Then, grab a Lucenia trial license from the “Try It Now” button here. After receiving the license and downloading it from the email, run:
cp ~/Downloads/trial.crt node/config
3. Run ```docker compose up```. If the license is in the proper place, the node should be running in the terminal:

Let’s create a Python virtual environment to keep all the packages in one place. Something to keep in mind with Python is that installations and configurations can vary by operating system and Python installations.
python3 -m venv venv
4. Activate the virtual environment:
source venv/bin/activate
5. Install the packages from the requirements.txt file by running pip3 install -r requirements.txt.
Spatial Analysis with opensearchpy Python client
This tutorial uses the opensearchpy python client to connect with Lucenia. The scripts in /python_client/bulk_insert.py will take care of checking if the indices exist and inserting the data.
- This will initialize the client:
client = OpenSearch(
   hosts=[{"host": "localhost", "port": 9200}],
   http_compress=True,
   http_auth=("admin", "MyStrongPassword123!"),
   use_ssl=False,
   verify_certs=False,
   ssl_assert_hostname=False,
   ssl_show_warn=False,
)
Then, for both indices, we’ll run bulk inserts into the Lucenia node.
At this point, with the data present, we can begin to find some insights by running python3 python_client/get_flood_zone_stats.py, which will run the following query to get the total number of buildings in the various flood zones in the Asheville area.
{
       "query": {
           "bool": {
               "filter": {
                   "geo_shape": {
                       "building": {
                           "shape": {
                               "type": "polygon",
                               "coordinates": flood_zone_polygon,
                           },
                           "relation": "within",
                       }
                   }
               }
           }
       }
   }
Broken down into parts, this query will run a yes/no check on geo_shape polygons, or buildings, that are fully contained within geo_shape polygons from the flood_plane index. This is made simple by Lucenia having built in logic to handle spatial relationships. The totals for this are as follows:

This tutorial should provide a good starting point for using Lucenia with Python for geospatial search needs. Users can build on this foundation for more advanced geospatial analytics, such as geo_tile_grid aggregations for creating heatmaps of regions with the most damage from meteorological events. Lucenia can help aid in disaster response design, implementation, and execution.
.svg)
